

The hidden charges ecommerce merchants often miss fall into ten categories: payment processing effective-rate leakage, marketplace fee stacks, shipping dimensional surcharges, return and chargeback costs, long-term storage penalties, per-order app fees, customer-acquisition waste, supplier cost drift, manual reconciliation labor, and currency conversion fees on cross-border transactions. Most of these never appear as line items in a bank deposit — they are deducted before the payout hits your account, making them nearly invisible in standard bookkeeping.
30-minute audit: start here
- Pull your last 30 days of marketplace settlement reports and processor statements.
- Divide total processing fees by total gross revenue to get your effective payment rate.
- Sample 10 SKUs across channels and calculate a per-order net margin using gross sale minus every deducted fee.
- Compare your 1099-K gross sales figure to actual bank deposits for the same period — the gap is your hidden fee total.
- Flag any SKU or channel where net margin is below 15% for immediate review.
Merchants who run this audit typically find several percentage points of margin they did not know they were losing.
Key Takeaways
Hidden charges in ecommerce most often appear in payment processing effective rates, marketplace fee stacks, shipping surcharges, and return costs — and the fastest way to find them is to reconcile gross order data to settlements at the order level.
| Point | Details |
|---|---|
| Effective processing rate | Divide total processing fees by gross revenue; rates above 3.2% signal recoverable leakage. |
| Marketplace fee stacks | All-in fees can reach 15–45% of sale price; model every channel separately before pricing, as fee stack percentages vary notably by platform, category, and fulfillment method. |
| Per-order unit economics | A $65 product with $22 COGS nets only $11.94 after all real fees are applied in the worked example; this matches the detailed per-order breakdown above, where net margin is calculated after accounting for referral fees, fulfillment, storage, processing, shipping, returns, ad spend, app fees, and chargeback reserves. |
| 30/60/90 audit workflow | Pull settlement reports, processor statements, and carrier invoices; reconcile at the order level. |
| Paysec Network Offset Pricing | Clients report 30–60% processing cost reductions with full per-transaction fee transparency. |
Table of Contents
- Why hidden charges are so hard to spot in standard reports
- What are the hidden charges ecommerce merchants most often miss?
- How do you find hidden charges in your own data?
- A worked per-order example that shows cumulative hidden charges
- How do you stop fee leakage and recover what you have already lost?
- What U.S. regulations apply to fee disclosure for ecommerce merchants?
- Which tools help you detect hidden charges automatically?
- How Paysec clients have reduced payment-processing costs
- Why per-order visibility is the metric that actually protects margins
- Paysec eliminates payment processing as a hidden charge
- Sources
- FAQ
Why hidden charges are so hard to spot in standard reports
Marketplaces and payment processors pay out net deposits. Amazon, Walmart Marketplace, and most payment gateways deduct their fees before transferring funds, so your bank statement shows one clean number with no breakdown. That single deposit looks like revenue. It is not.
Recording only net deposits hides platform fees; merchants who record that deposit as gross revenue cannot compute accurate contribution margins or identify which channel is actually profitable. The fix is to record gross sales as revenue and map every marketplace fee as a separate expense line.
The problem compounds across three statement types most merchants never reconcile against each other:
- Marketplace settlement files — show gross sale, referral fee, fulfillment fee, storage fee, and other deductions per order, but require a manual download from Seller Central, Walmart Seller Center, or your platform's finance dashboard.
- Processor statements — show interchange, assessment, gateway, and markup fees, often in a format that requires knowing what each line code means.
- 3PL and carrier invoices — show base shipping rates plus fuel surcharges, residential delivery fees, dimensional weight adjustments, and address-correction charges, typically on a separate billing cycle from order fulfillment.
When these three live in separate systems and no one reconciles them at the order level, fees stay invisible.
Pro Tip: Compare your 1099-K gross sales total to the sum of your bank deposits for the same calendar year. The difference is the floor estimate of fees deducted at source. For most multi-channel merchants, this gap runs into thousands of dollars annually.
What are the hidden charges ecommerce merchants most often miss?
Payment processing and effective-rate leakage
The advertised rate — typically 2.9% plus $0.30 — is not what most merchants actually pay. Advertised card rates understate the effective processing rate; card mix premiums (Amex runs higher than Visa debit), chargebacks where the processing fee is not refunded, cross-border fees on international cards, and fixed per-transaction fees on low-AOV orders commonly push effective rates several tenths to over a full percentage point higher than the headline.
Calculate your effective rate: total processing fees divided by total gross revenue. If the result is above 3.2%, you have a leakage problem worth fixing.
Detection checks: pull your processor's monthly statement, find the "total fees" line, and divide by gross volume. Most merchants actually pay an effective processing rate of 3.2–4.5% — higher than the typical advertised rate — due to factors like card mix, chargebacks, currency conversion, and fixed per-transaction fees. Then look for line items labeled "NABU," "FANF," "ISA," or "cross-border" — these are network assessment and international fees that rarely appear in advertised pricing.
Marketplace and platform fee stacks
Marketplace fee stacks — referral, fulfillment, storage, and surcharges — can consume a substantial portion of the sale price depending on platform, category, and fulfillment method. Amazon FBA merchants pay a referral fee (typically 8–15% by category), a fulfillment fee per unit, monthly storage, and, for slow-moving inventory, long-term storage fees after 181 and 365 days. days. Walmart Marketplace and WFS (Walmart Fulfillment Services) have their own referral and fulfillment fee schedules that differ from Amazon's, and two platforms with the same headline percentage can have very different all-in costs once inclusions are normalized.
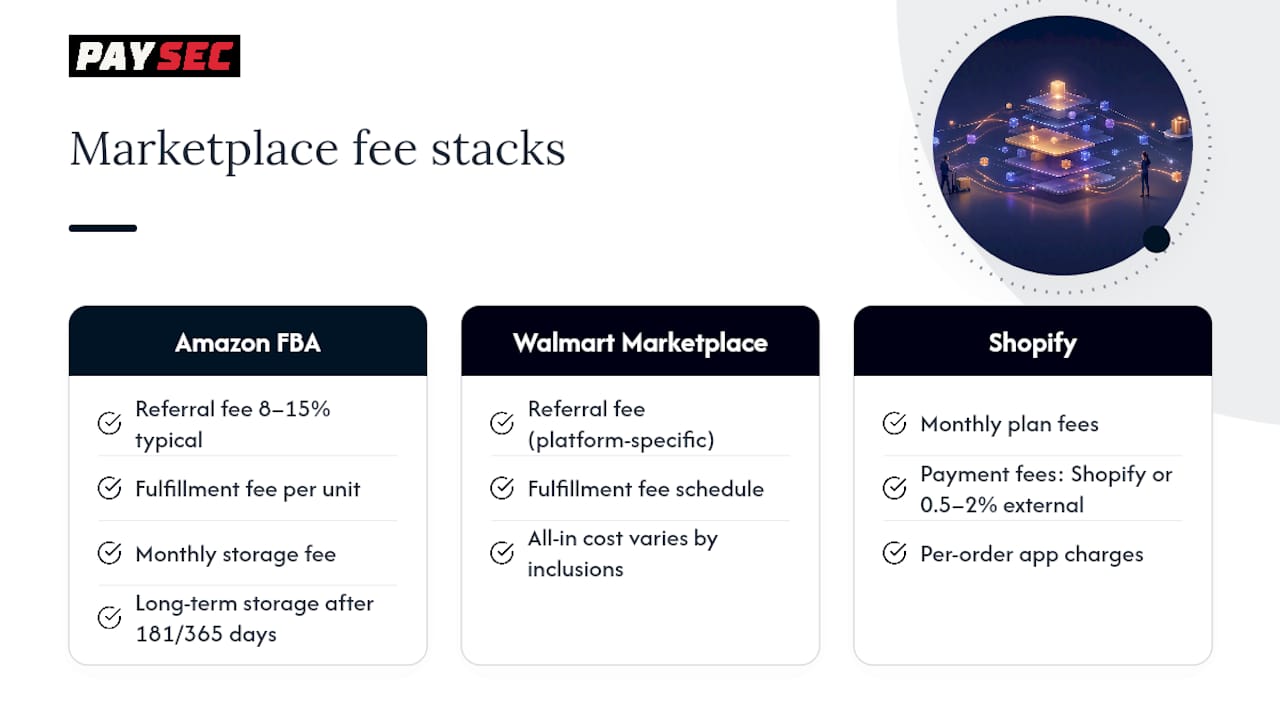
Shopify merchants face a different stack: monthly plan fees, Shopify Payments transaction fees (or third-party payment provider fees, typically around 0.5–2%)% on top of processing if you use an external gateway), plus per-order charges from installed apps.
Detection checks: download a full settlement report from each marketplace, sum all fee columns per order, and divide by gross sale price. Compare that all-in percentage across channels.
App and SaaS subscription fees that become per-order costs
A $49/month app sounds trivial until you run 500 orders per month — then it is $0.10 per order before you count the app's per-order or per-listing fees. Many Shopify apps charge both a monthly base and a per-transaction or per-listing fee that scales with volume. Review apps, loyalty apps, subscription billing tools, and shipping-rate calculators frequently carry these dual-charge structures.
Detection check: export your Shopify billing history, list every app charge for the past 90 days, and divide total app spend by order count.
Shipping surcharges and dimensional pricing
Carriers price on dimensional weight, not actual weight, for packages above a certain density threshold. A lightweight but bulky item can cost two to three times more to ship than its actual weight suggests. On top of that, fuel surcharges (adjusted weekly by UPS and FedEx), residential delivery fees, extended-area surcharges, and address-correction charges add $3–$8 per package in costs that rarely appear in the rate quote you saw at checkout.
Failed deliveries and return-to-origin shipments are double costs: you pay to ship out and to ship back, plus a restocking or disposal fee.
Detection check: pull carrier invoices and look for surcharge line items beyond the base rate. Compare the invoiced total per shipment to the rate you quoted at checkout.
Returns, refunds, chargebacks, and reverse logistics
A returned order costs more than the refund amount. The full landed cost of a lost sale includes: the original outbound shipping, the return shipping label, restocking labor, any refurbishment or disposal cost, and the original payment processing fee (which most processors do not refund on a return). Chargebacks add a $15–$100 dispute fee per incident on top of the lost sale value.

Friendly fraud — where a customer disputes a legitimate charge — is a growing share of chargeback volume. Prevention tools like Signifyd or Kount can reduce exposure, but the cost of those tools must also be counted per order.
Pro Tip: Track your return rate and average return cost per order as a standing metric. A 15% return rate on a $50 item with a $12 all-in return cost reduces your effective margin by $1.80 per order across your entire catalog — before you account for lost inventory value.
Inventory holding and long-term storage surcharges
Amazon charges monthly storage fees per cubic foot, with rates that increase significantly in Q4. Inventory that sits past 181 days incurs long-term storage fees; past 365 days, the fees escalate further. These charges accumulate silently on slow-moving SKUs and rarely appear in a merchant's standard P&L unless someone pulls the FBA inventory health report and maps storage fees to individual ASINs.
Detection check: run the FBA Inventory Age report monthly. Flag any ASIN with more than 90 days of inventory on hand and calculate the projected long-term storage fee against the unit's contribution margin.
Customer-acquisition cost leakage at the order level
Ad spend is often tracked at the campaign level, not the order level. A merchant might know their blended CAC is $18, but not know that 40% of that spend is going to branded keywords that would have converted organically anyway, or that one product category has a CAC of $45 against a $38 contribution margin. Attribution blind spots — last-click models that ignore the full funnel, or ad platform reporting that counts view-through conversions — inflate apparent ROAS and hide true per-order acquisition cost.
Detection check: pull ad spend by product category or SKU, divide by attributed orders, and compare to per-order contribution margin from your unit-economics model.
Supplier cost drift, freight pass-throughs, and vendor fees
Supplier invoices change. A vendor raises material costs by 4%, adds a fuel surcharge to freight, or introduces a minimum order quantity that forces you to carry more inventory than you need. These changes often arrive as line items on invoices that accounts payable processes without flagging the unit-cost increase to the merchant's pricing team.
Detection check: compare your current landed cost per unit to the cost you used when you last set retail pricing. Any increase above 2% warrants a pricing review.
Labor and reconciliation time costs
Manual reconciliation — matching orders to settlements to invoices — takes time that scales with order volume. At 1,000 orders per month, even 30 seconds of manual exception handling per order is 8+ hours of labor monthly. That labor cost is real but rarely counted in per-order economics.
Packaging, damage claims, tax assessments, and currency fees
Oversized or poorly dimensioned packaging inflates dimensional weight charges on every shipment. Damage claims require documentation and follow-up time, and carrier reimbursements are rarely automatic. On the tax side, marketplace facilitator laws in most U.S. states require marketplaces to collect and remit sales tax, but use tax on purchases you make for your business, excise taxes on certain product categories, and cross-border currency conversion fees on international card transactions are costs merchants must track themselves.
How do you find hidden charges in your own data?
The fastest path is to reconcile gross order data to settlements and vendor statements at the order level. Here is a structured workflow:
30-minute audit
- Download the last 30 days of settlement reports from every marketplace (Amazon Seller Central > Reports > Payments; Walmart Seller Center > Finances; Shopify > Finances > Payouts).
- Download your payment processor statement for the same period.
- Open a spreadsheet. Create columns: Order ID, Gross Sale, Referral Fee, Fulfillment Fee, Storage Allocation, Processing Fee, Shipping Cost, App Fees, Other Deductions, Net Revenue.
- Populate 10 orders across your top SKUs. Calculate net revenue for each.
- Divide total fees by gross sale for each order to get the all-in fee percentage.
60-minute audit
- Pull your carrier invoices and match surcharge line items to the same 10 orders.
- Add a CAC column: divide last month's ad spend by attributed orders for each product category.
- Add a returns allocation: multiply your return rate by average return cost and add it as a per-order charge.
- Recalculate net margin with all columns populated.
90-minute audit
- Pull your app billing history and divide total app spend by order count to get a per-order app fee.
- Check your FBA Inventory Age report. Divide total storage fees by units sold to get a per-unit storage allocation.
- Query your processor for a fee breakdown by card type. Identify Amex volume and cross-border volume as separate line items.
- Screenshot every statement page that shows a fee you cannot explain. These become your escalation evidence.
- Compare your 1099-K gross sales to bank deposits to confirm your hidden fee floor estimate.
For the payment stack specifically, the ecommerce payment stack components — gateway, processor, and merchant account — each carry fee layers that require separate statement review.
A worked per-order example that shows cumulative hidden charges
A $65 product with a $22 COGS looks profitable at first glance. Apply every real fee and the picture changes fast.
That 18.4% net margin is before accounting for any supplier cost drift, packaging inefficiency, or labor. If the merchant had priced this SKU assuming a 30% margin based on COGS alone, they are operating at nearly half their expected profitability.
The two highest-impact line items in this example are the ad CAC allocation ($8.00) and the Amazon referral plus fulfillment stack ($15.15 combined). Those two alone consume 35.6% of the gross sale price.
To replicate this in a spreadsheet:
- Column A: line item name
- Column B: source (which export or invoice)
- Column C: amount per order
- Column D: percentage of gross sale
Pull the referral and fulfillment fees from your settlement export. Pull the effective processing rate from your processor statement. Pull the CAC from your ad platform's order-attributed spend report. Pull the returns allocation from your returns report (return rate × average return cost). Pull the storage allocation from your FBA Inventory Age report (total storage fees ÷ units sold in the period).
How do you stop fee leakage and recover what you have already lost?
Start with changes that affect per-order economics today, then move to medium-term contract and tooling fixes.
Quick wins (this week)
- Raise AOV by bundling low-margin SKUs with higher-margin items — fixed per-order fees become a smaller percentage of a larger sale.
- Shift payment acceptance mix: encourage ACH for B2B orders where possible. Interchange is the largest cost component, and ACH eliminates card network fees entirely for eligible transactions.
- Remove or consolidate Shopify apps with overlapping functions. Two apps doing similar jobs at $0.10 per order each add $0.20 per order to your cost base.
- Audit packaging dimensions against carrier dimensional weight thresholds. Reducing a box by one inch in one dimension can drop a package into a lower dimensional weight tier.
Medium-term fixes (30–60 days)
- Request interchange-plus pricing from your processor if you are processing above $10,000/month. Flat-rate pricing benefits the processor at scale; interchange-plus passes the actual card cost through with a fixed markup, which is typically lower for debit-heavy card mixes.
- Negotiate carrier rate agreements. Volume commitments above a threshold qualify for negotiated base rates and surcharge caps with major carriers.
- Dispute short settlements and damaged-return reimbursements. Marketplaces have formal reimbursement programs for lost or damaged FBA inventory; file claims within the allowed window (typically 18 months for Amazon).
- Review your payment processing fee components to identify which optional fees you are paying that could be removed or renegotiated.
Structural fixes (60–90 days)
- Build a channel-level P&L for every marketplace and sales channel. Any channel where all-in fees exceed 35% of gross sale price needs a pricing adjustment or a volume reduction.
- Move slow-moving FBA inventory to a 3PL or back to your own warehouse before it hits the 181-day long-term storage threshold.
- Automate reconciliation (see the tools section below) so fee spikes trigger alerts rather than accumulate undetected.
Negotiation checklist for carrier and processor conversations:
- Ask for your current effective rate in writing before the call.
- Request a line-item breakdown of every surcharge applied in the last 90 days.
- Ask specifically about interchange-plus pricing, volume tier discounts, and waived monthly minimums.
- Get any agreed rate change confirmed in writing before the new billing cycle.
What U.S. regulations apply to fee disclosure for ecommerce merchants?
The FTC and state regulators are increasing transparency requirements, and certain fees must be included in the advertised total price or disclosed clearly before payment is collected.
The FTC's Rule on Unfair or Deceptive Fees requires sellers in covered contexts to disclose the total price upfront and to show any excluded charges before asking for payment. Drip pricing — revealing fees only at the final checkout step — is the practice most directly targeted. Junk fees and drip pricing are widespread, and consumer-facing pressure is driving greater legal scrutiny of merchants who add fees late in the checkout flow.
Junk fees are defined as mandatory charges that are undisclosed at the initial price and often unrelated to a requested service. When disputing an undisclosed fee, document the advertised price and the final charged price — that gap is the evidence regulators and card networks look for.
On card surcharging: Visa and Mastercard rules permit merchants to surcharge credit card transactions in most U.S. states, but the surcharge must be disclosed at the point of entry and on the receipt, capped at the merchant's actual processing cost, and not applied to debit cards. Several states, including Connecticut, Massachusetts, and Puerto Rico, ban credit card surcharges entirely. Check your state's current rules before implementing any surcharge program.
Compliance checklist:
- Display the total price (including all mandatory fees) on product pages and in cart, not just at final checkout.
- If you exclude any charge from the initial price, disclose it clearly before the payment screen.
- Update your checkout flow to show the final charge amount before the customer clicks "Pay."
- Review marketplace listing policies — Amazon and Walmart have their own fee-disclosure requirements for sellers.
- Confirm your surcharge disclosure language with your payments partner and legal counsel before activating.
- Document your advertised vs. charged prices for at least 12 months in case of a dispute or audit.
Regulatory note: The FTC's junk-fee guidance is general information, not legal advice. Confirm current rules with a qualified attorney or your payments compliance partner before making changes to your pricing display or surcharge program.
Which tools help you detect hidden charges automatically?
Automate three core reconciliations: orders to settlements, 3PL invoices to shipments, and ad spend to attributed orders. Once those three are running on a scheduled basis, fee spikes surface as alerts rather than surprises.
Tool categories to consider:
- Settlement aggregation tools — pull settlement data from multiple marketplaces into one view, flag discrepancies between expected and actual payouts, and generate per-order fee reports. Look for tools that connect directly to Amazon, Walmart, and Shopify settlement APIs.
- Accounting sync tools — connect marketplace and processor data to QuickBooks, Xero, or NetSuite, recording gross sales and fees as separate line items rather than net deposits. This is the direct fix for the gross-vs.-net blind spot.
- Payment analytics platforms — track effective processing rate by card type, flag cross-border fee spikes, and monitor chargeback rates by product category. Paysec's real-time payment reporting provides this visibility at the transaction level, including detailed fee breakdowns that make effective-rate calculation straightforward.
- 3PL and TMS connectors — match carrier invoices to shipment records, flag surcharges above a defined threshold, and generate per-shipment cost reports.
- Advertising attribution tools — move beyond last-click attribution to model-based or data-driven attribution that assigns ad spend to orders more accurately, reducing CAC blind spots.
Implementation checklist:
- Map every data export you need: settlement files, processor statements, carrier invoices, ad platform billing, app billing.
- Set a weekly scheduled job to pull and reconcile each source.
- Create alerts for: effective processing rate above your target threshold, storage days per SKU exceeding 90 days, return rate per product above 10%, per-order app fees above $0.50.
- Review the alert log monthly and escalate any fee that cannot be explained by a known rate change.
For merchants evaluating payment solution features, real-time fee reporting and per-transaction breakdowns are the two capabilities that most directly support ongoing hidden-charge detection.
How Paysec clients have reduced payment-processing costs
Payment processing is one of the most recoverable hidden costs because the rate structure is negotiable and the savings show up immediately on every transaction.
Paysec clients across ecommerce, SaaS, and retail have reported the following outcomes after switching to Network Offset Pricing and interchange-plus structures:
- Processing cost reductions of 30–60% compared to prior flat-rate or bundled pricing arrangements.
- A documented 42% reduction in processing costs in one client case, achieved by moving from a flat-rate model to Paysec's Network Offset Pricing with full interchange-plus transparency.
- Elimination of hidden markup layers — Paysec's detailed transaction reporting shows interchange, assessment, and markup as separate line items, so merchants can verify they are paying actual card costs rather than an opaque bundled rate.
Results vary by card mix, volume, and prior pricing structure. The per-order spreadsheet from the worked example above is the right tool for modeling your own expected savings before making any switch.
Why per-order visibility is the metric that actually protects margins
Per-order visibility converts bookkeeping into decisions that protect margins. A blended P&L tells you whether the business made money last month. A per-order model tells you which SKUs, channels, and customer segments are profitable today and which ones are quietly subsidized by the ones that are.
Merchants who run the 30/60/90 audit described in this article consistently find that two or three fee categories account for the majority of their leakage. Fixing those two or three categories does not require a full operational overhaul — it requires knowing which numbers to look at and where to find them.
The 30-minute audit in the opening section is the right starting point. Run it this week, identify your top two leak sources, and reach out for a payments analysis if processing costs are one of them.
— PaySec Marketing Team
Paysec eliminates payment processing as a hidden charge
Most merchants discover their true processing cost only after they calculate the effective rate for the first time. Paysec's Network Offset Pricing makes that number visible on day one — and then reduces it.
Paysec gives ecommerce merchants interchange-plus pricing with no bundled markup layers, detailed per-transaction reporting that separates interchange, assessment, and processor fees, and no long-term contracts or monthly minimums. Clients have documented processing cost reductions of 30–60%, with one merchant recording a 42% reduction after switching from a flat-rate model.
- No hidden fees — every fee component is itemized in real-time dashboards.
- No long-term contracts — start, adjust, or stop without penalty.
- 30–60% typical savings on processing costs versus prior flat-rate arrangements.
- PCI DSS Level 1 and SOC 2 compliant — security and compliance are included.
Book a free payments analysis at Paysec to see your current effective rate benchmarked against what interchange-plus pricing would cost you per order.
Sources
- Gross vs. Net Revenue in Ecommerce: Missing Fees Explained
- Rule on Unfair or Deceptive Fees: Frequently Asked Questions
- Payment Processing Fees for Ecommerce: True Cost Guide 2026 | Niblin
- Marketplace Fees on Amazon & Shopify: True Cost | CentSight
- Marketplace Fees Compared: Amazon vs eBay vs Walmart
- How to avoid hidden fees | Consumer Reports
- What are junk fees — examples, laws, and penalties | LegalClarity
This article is general information, not a substitute for advice from a qualified financial advisor. Consult a qualified financial professional about your own circumstances before acting on anything here.
FAQ
Why do companies charge hidden fees?
Hidden fees are often the result of cost structures that processors, marketplaces, and carriers pass through in ways that are not visible in advertised pricing. Platforms deduct fees before paying out net deposits, making the charges invisible in standard bank reconciliation unless merchants pull and analyze settlement-level data.
What is the biggest financial problem ecommerce merchants face?
Margin erosion from stacked, untracked fees is among the most common. A product that appears profitable at the COGS level can net a single-digit percentage margin after payment processing, marketplace fees, shipping surcharges, returns, and ad spend are applied per order, as the worked example in this article shows.
How do I calculate my true payment processing cost?
Divide your total processing fees for a period by your total gross revenue for the same period. The result is your effective processing rate. Rates above 3.2% typically indicate card mix premiums, cross-border fees, or markup layers that can be reduced by switching to interchange-plus pricing.
What is the 80/20 rule in ecommerce?
In ecommerce, the 80/20 principle generally holds that a minority of SKUs or customers account for the majority of revenue. Applied to hidden fees, it means that two or three fee categories typically account for the majority of margin leakage — identifying and fixing those top categories delivers most of the recoverable savings.
Can Paysec help reduce my effective processing rate?
Paysec's Network Offset Pricing and interchange-plus structure give merchants full visibility into interchange, assessment, and markup as separate line items. Clients have reported processing cost reductions of 30–60%, with one documented case showing a 42% reduction after switching from a flat-rate model.